This study focuses on analyzing food wastage behavior of consumers in Singapore. Qualitative research with experts from food waste management organizations and restaurant operators indicated key reasons for food wastage to be food spoilage, risk of hurting brand due to substandard food, lack of appropriate methods for sorting food, reverse logistics for proper waste collection/disposal, and appropriate recycling facilities. High costs of waste disposal, lack of government incentives or regulations governing service providers, and lack of awareness among consumers also contributed to solid food waste in Singapore. A survey with consumers recorded their habits with regard to planning food purchases, food wastage while cooking, and wastage during consumption of cooked, canned, and ready-to-eat products. A stepwise multiple discriminant analysis done on a key categorical variable “How much effort do you take to minimize amount of uneaten food you throw away?” yielded two groups that differed significantly along several attitudinal/behavioral dimensions. KEYWORDS food wastage, sustainability, social entrepreneurship, multiple discriminant analysis
Introduction
It has been estimated that roughly one third of food produced in the world every year is wasted. It is reported that approximately 1.3 billion tons of the food produced never reaches the human stomach.
Address correspondence to Jyothsna Appaiah Singh, Exec. Intelligence, Strategy and Development, Economic Zones World, Jafza 14, Jebel Ali, Dubai, UAE. E-mail: jyothsna.appaiah@ezw.com
Color versions of one or more of the figures in the article can be found online at www.tandfonline.com/wfpm.
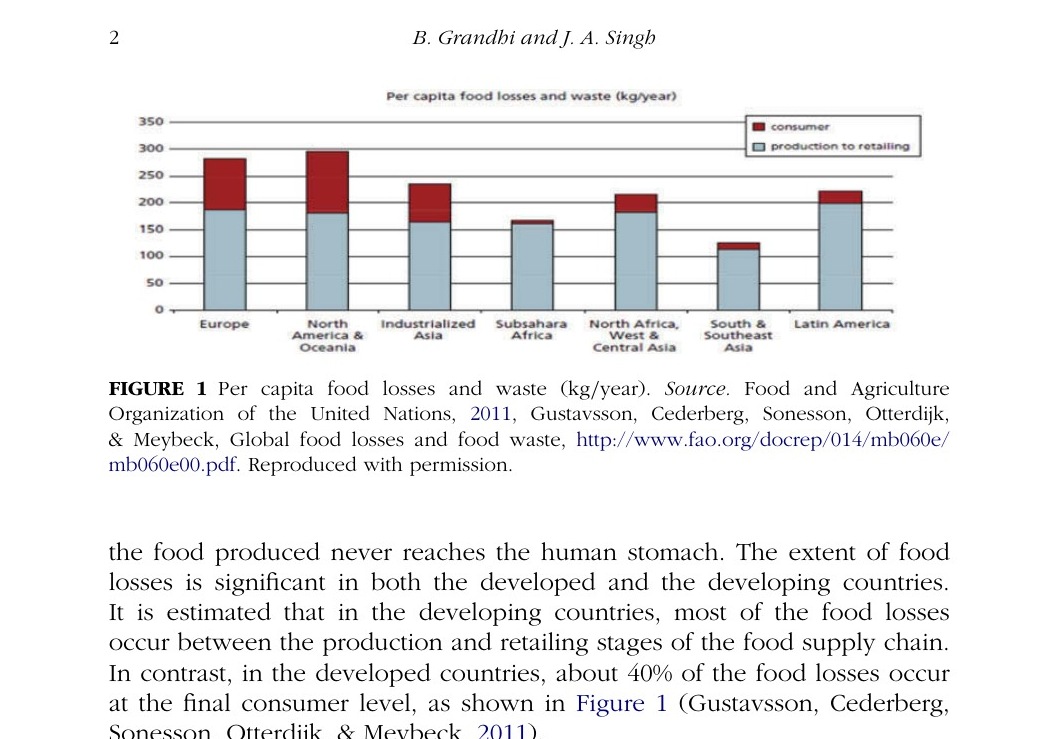
Source. Food and Agriculture Organization of the United Nations, 2011, Gustavsson, Cederberg, Sonesson, Otterdijk, & Meybeck, Global food losses and food waste, http://www.fao.org/docrep/014/mb060e/mb060e00.pdf. Reproduced with permission.
The extent of food losses is significant in both the developed and the developing countries. It is estimated that in the developing countries, most of the food losses occur between the production and retailing stages of the food supply chain. In contrast, in the developed countries, about 40% of the food losses occur at the final consumer level, as shown in Figure 1 (Gustavsson, Cederberg, Sonesson, Otterdijk, & Meybeck, 2011). Food losses happen at different stages of the food supply chain, starting from agricultural production through post–harvesting and handling, processing, distribution, warehousing, retailing, and final consumption. The losses are due to inappropriate purchasing, storage, and preparation. The losses occurring at the end of the food chain (i.e. at the final consumption level) is termed food waste and forms the basis of this study (Gustavsson et al., 2011). The National Environment Agency (NEA) is the public body responsible for the solid waste management process in Singapore. It regulates solid waste collection, recycling, and incineration as it relates to all kinds of waste. As shown in Figure 2, in 2012 about 7.3 million tons of waste was generated in Singapore, and each person generated around 1,370 kg of waste in a year. The overall recycling rate (across all kinds of waste) in Singapore for 2012 is 60% (59% in 2011), and it has been increasing steadily over the years (Tay, 2013). As observed in Figure 3, the food waste category is the fifth largest, contributing 10% of the waste among all the waste categories in Singapore; however, its recycling rate is among the lowest. The food waste disposal stands at about 23% of the total. It is an indication of huge food losses and minimal alternatives available to salvage the losses in Singapore. As seen more evidently in Figure 4, food waste recycling is one among the lowest at 13% for 2014. This indicates a huge window of opportunity for management of food waste across the city.
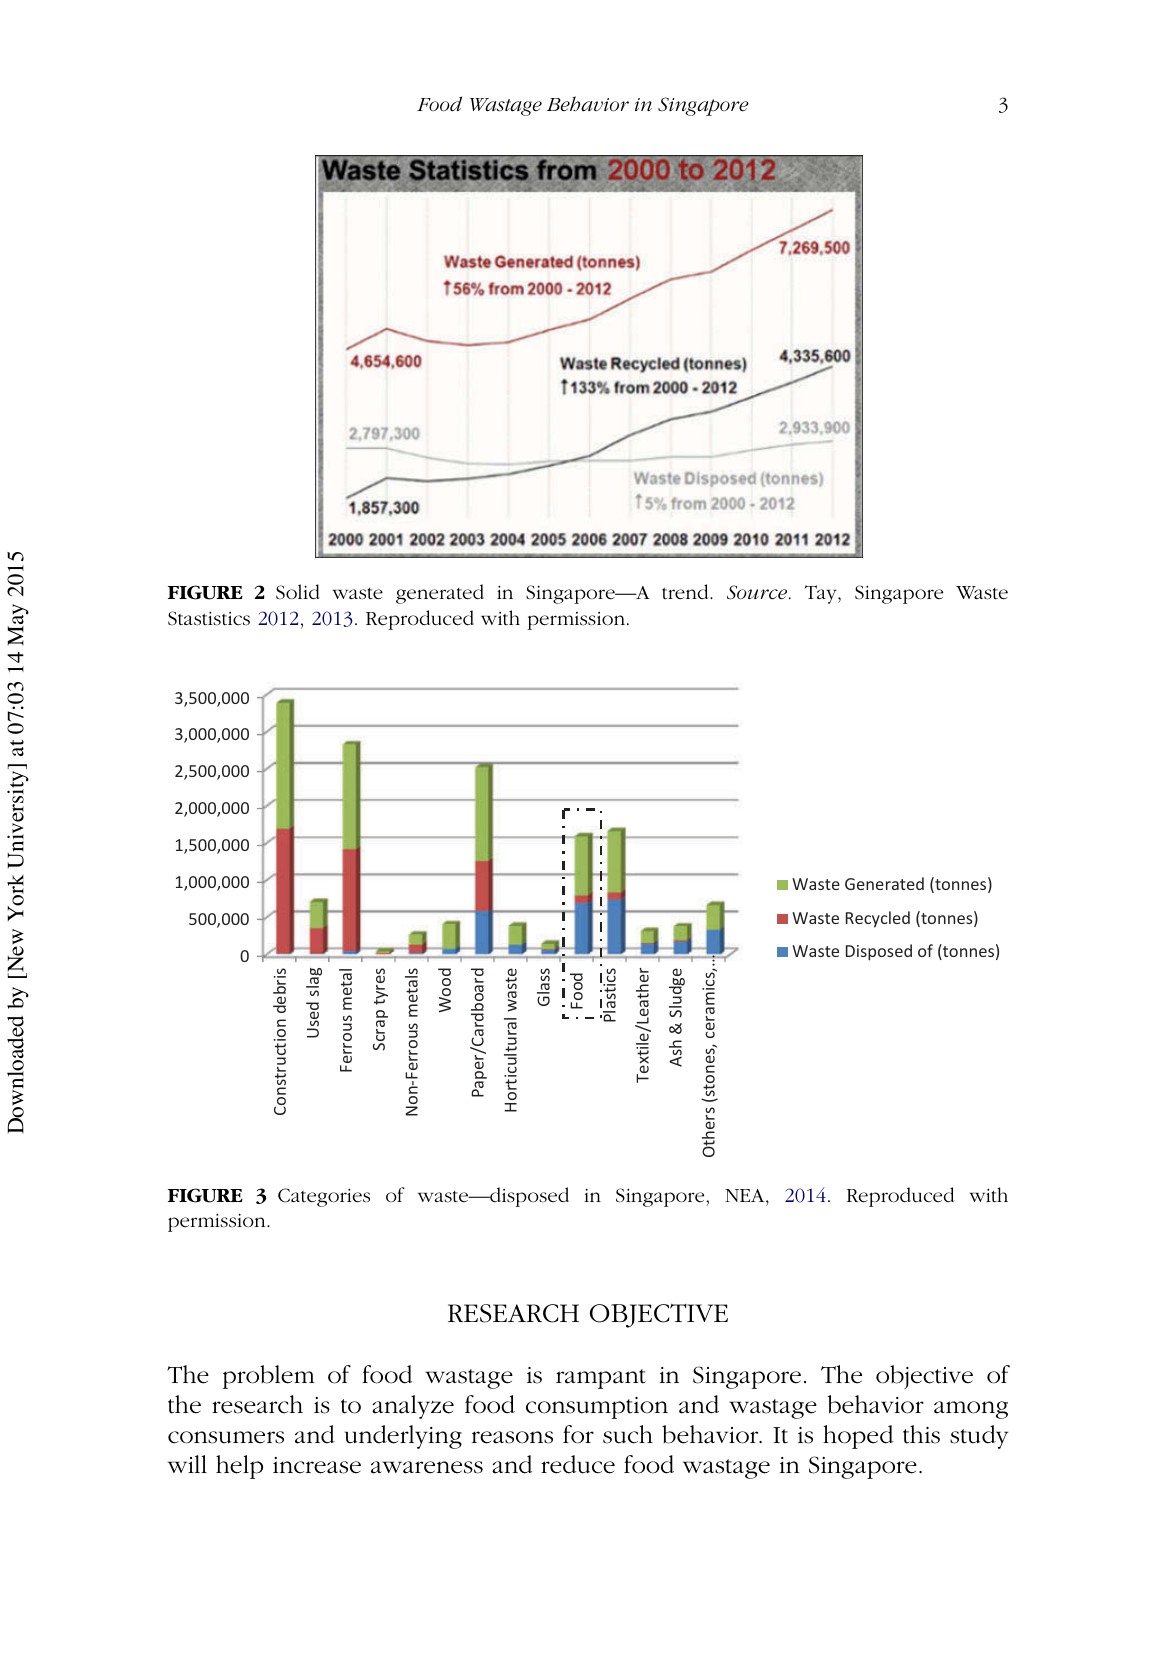
Source. Tay, Singapore Waste Statistics 2012, 2013. Reproduced with permission.
3,500,000
3,000,000
2,500,000
2,000,000
1,500,000
Waste Generated (tonnes)
500,000
Waste Recycled (tonnes) Ash & Sludge
Textile/Leather
Food
Plastics
Glass
Horticultural waste
Wood
Paper/Cardboard
Scrap tyres
Non-Ferrous metals
Used slag
Ferrous metal
Others (stones, ceramics,…
1,000,000
Construction debris
Waste Disposed of (tonnes)
Source. NEA, 2014. Reproduced with permission.
Research objective
The problem of food wastage is rampant in Singapore. The objective of the research is to analyze food consumption and wastage behavior among consumers and underlying reasons for such behavior. It is hoped this study will help increase awareness and reduce food wastage in Singapore.
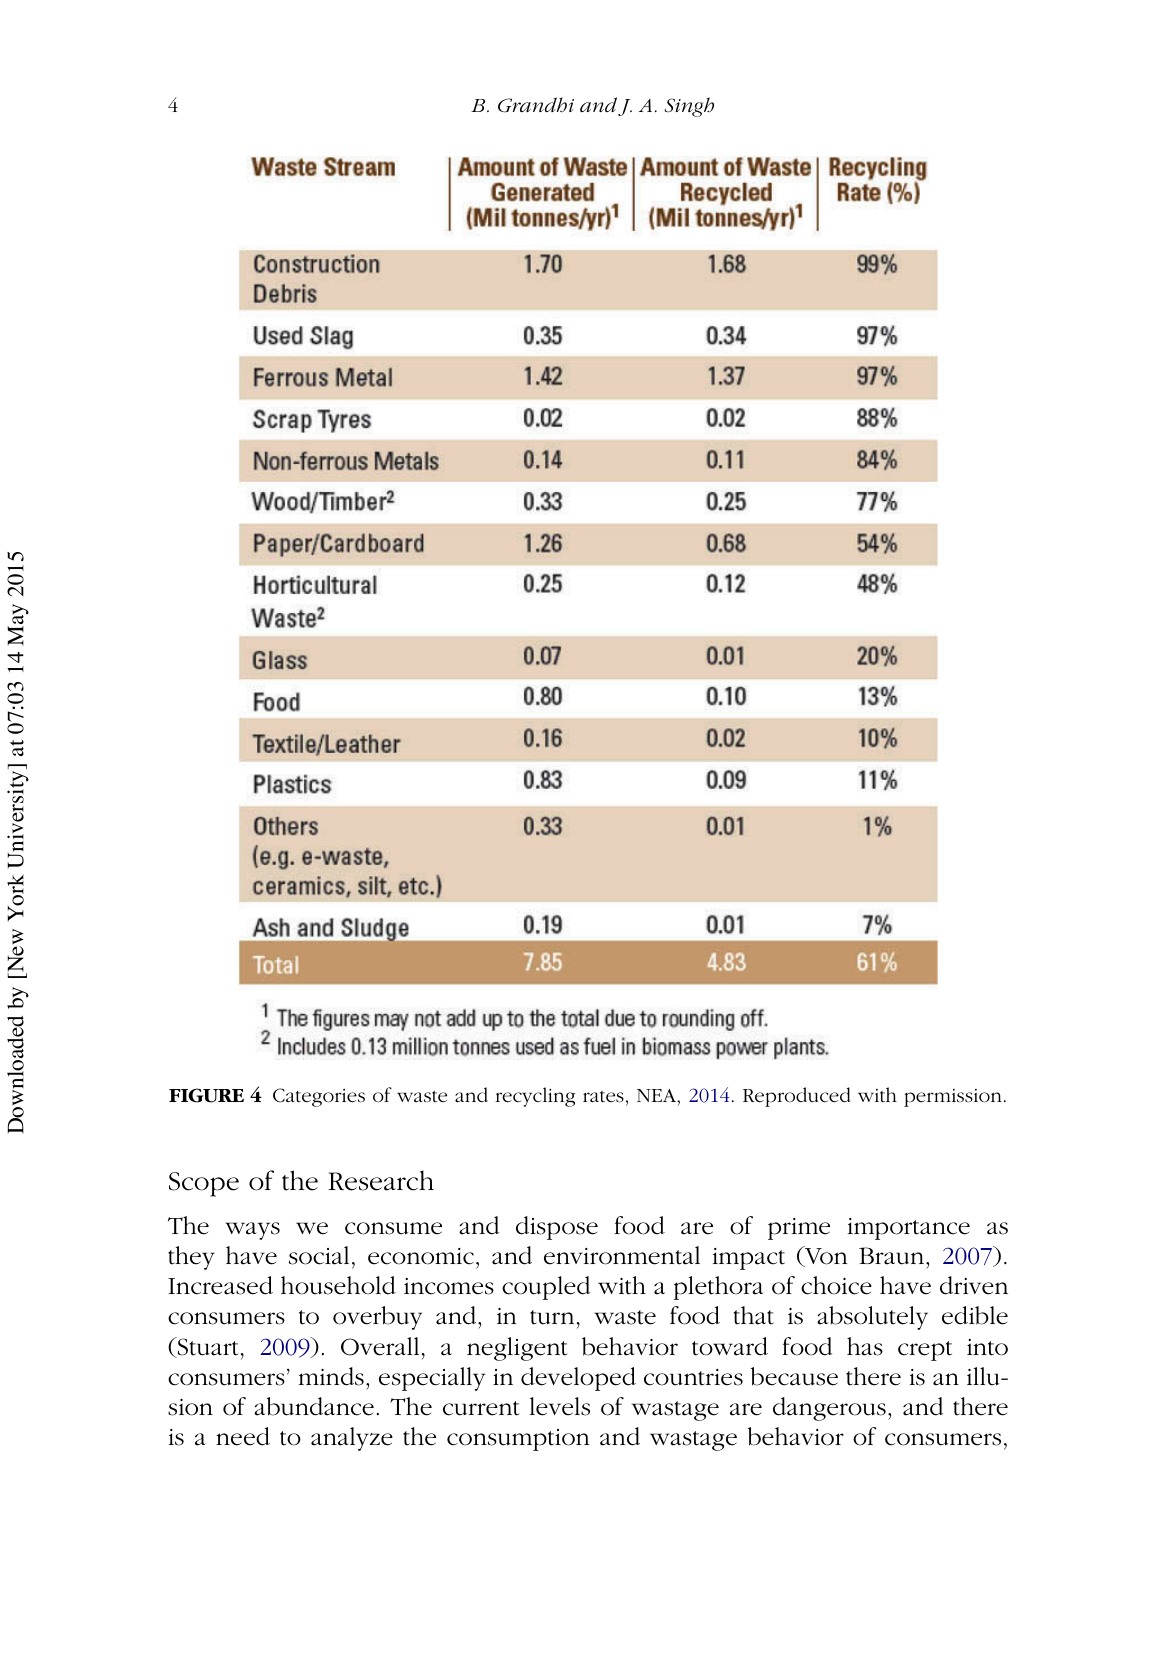
Source. NEA, 2014. Reproduced with permission.
Scope of the Research
The ways we consume and dispose food are of prime importance as they have social, economic, and environmental impact (Von Braun, 2007). Increased household incomes coupled with a plethora of choice have driven consumers to overbuy and, in turn, waste food that is absolutely edible (Stuart, 2009). Overall, a negligent behavior toward food has crept into consumers’ minds, especially in developed countries because there is an illusion of abundance. The current levels of wastage are dangerous, and there is a need to analyze the consumption and wastage behavior of consumers, thereby understanding the drivers of food wastage (WRAP, The food we waste, 2008).
Food Wastage Behavior
Studies have been conducted to investigate the sociodemographic factors responsible for food wastage; however, very few have studied psychographic factors, which, in fact, have a greater significance for understanding the root causes of food wastage. This study involved identifying the drivers of food wastage at the household level, defined as the food brought home or prepared at home but not consumed. The waste is currently handled by NEA through various channels such as waste collection centers, recycling centers, home composting, and animal feed. Wasted food is unavoidable and the authors made note of this in their findings, which provides more accurate results. A similar study categorized food wasted into avoidable, possibly avoidable, and unavoidable. The first two are considered to be edible, and the third is set aside as nonedible (Exodus Market Research, 2007; WRAP, 2009). A paradox in consumers’ behavior is that people do not like to project themselves as wasteful (Stefan, 2011). However, when it comes to food, the wastage levels are alarming. Food waste collection in developed countries is almost unknown to the consumers. Consumers just throw away waste in small quantities and are never bothered to know further (Arkes, 1996). It happens on a daily basis, and they do not realize the amount of their waste or feel responsible for it (De Coverly, McDonagh, O’Malley, & Patterson, 2008). The design and size of trash can also indicate the food waste behavior of consumers (Chappells & Shove, 1999). Consumers feel that wastage is an inevitable part of consumption. The producers and marketers influence their buying decisions by introducing discounts or special offers inducing consumers into impulsive shopping, which results in further wastage. According to a study done by Wrap in 2009, 96% of avoidable food waste happens due to cooking too much food and food not being used before the date of expiry. Some of the other reasons for wastage are breakage, spillage, package failure, and so forth. Research suggests that large number of consumers are not aware of the amount of food they dispose of on a regular basis (Hamilton, Denniss, & Baker, 2005; Lyndhurst & Brook, 2007). The majority of those who are aware of the environmental effects feel that food is biodegradable and hence cannot be harmful to the environment. Low awareness of the social impact of food wastage is evident in some people who seem to be completely ignorant of the other part of the world that suffers from undernourishment.
Findings and analysis
Sampling
Data were collected using a survey questionnaire. It was administered both online as well as offline. The sample size is 158, of which online respondents were 84 and offline were 74. A t test was conducted on all the continuous (scaled) variables for the offline and online sample respondents, to ascertain whether the sample base could be combined to perform analysis. This t test failed, indicating that there is no variance in the data collected via online or offline. Few categorical variables such as gender, age, and household income were tested as discriminating variables for conducting a multiple discriminant analysis; however, no significant differences were found. A few continuous variables were also chosen for testing as discriminating variables:
- Overall food waste behavior
- Does cost of food thrown away bother you?
- To what extent does food thrown away bother you?
A multiple discriminant analysis was next performed on the combined sample (online + offline of 158 respondents). The key categorical variable chosen for discriminant analysis was “How much effort do you take to minimize the uneaten food you throw away?” The options to the variable were a great deal, a fair amount, a little, not very much, and not at all. The more inclined to make an effort to minimize waste group (group 1) included the ones who marked the first two alternatives, and the less inclined group (group 2) included the ones who marked the remaining alternatives. A discriminant analysis was conducted to predict whether a consumer was more inclined to make an effort to minimize waste or not. This variable was derived from an interpretive study that looked at the realization of waste generated and the tendencies to minimize or not (DeCoverly, McDonagh, O’Malley, & Patterson, 2008). Several attitudinal variables and measures have been used in the past for similar research. Those considered pertinent have been used for this research. Predictor variables chosen were
- Throw fruits and vegetables whether cooked or not into the bin
- Throw raw meat and fish into the bin
- Throw processed meat and fish into the bin
- Throw readymade meals and convenience foods into the bin
- Throw food left on the plate after the meal
- Throw food from the previous meal that you saved and was not eaten/finished the next day
- Overall food that you waste (Hamilton, Denniss, & Baker, 2005)
- Thinking about when you have to throw uneaten food items away, to what extent, if at all, does it bother you?
- To what extent, if at all, do you think about the cost of the uneaten food you throw away? (De Coverly et al., 2008)
- Food thrown away is not an issue as it is natural and biodegradable (WRAP, 2009)
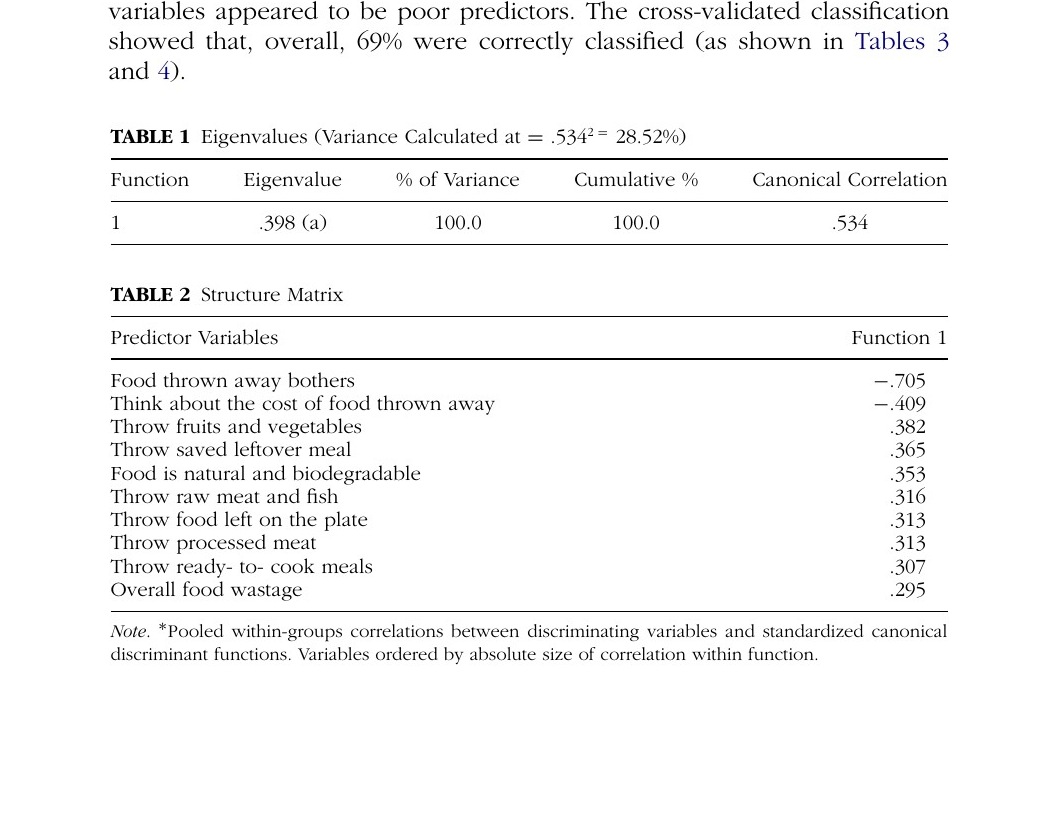
Significant differences in the mean were observed for all the predictors on the discriminating variable. The log determinants were quite similar, and Box’s M indicated that the assumption of equality of covariance matrices was violated, thus rejecting the null hypothesis (in discriminant analysis, the null hypothesis is that no variance exists in the sample collected) and suggesting significant variance between the two groups. The discriminate function revealed a significant association between groups and all predictors, accounting for 28.83% of between-group variability (as shown in Table 1), although closer analysis of the structure matrix (as shown in Table 2) revealed only “Thinking about when you have to throw uneaten food items away, to what extent, if at all, does it bother you?” (−.705) as a significant predictor. Other secondary predictors were “To what extent, if at all, do you think about the cost of the uneaten food you throw away?” (−.409) and “Throw fruits and vegetables whether cooked or not into the bin” (.382). All others variables appeared to be poor predictors. The cross-validated classification showed that, overall, 69% were correctly classified (as shown in Tables 3 and 4). TABLE 1 Eigenvalues (Variance Calculated at = .5342 = 28.52%) Function
Eigenvalue
% of Variance
Cumulative %
Canonical Correlation
100.0
100.0
.534
TABLE 2 Structure Matrix Predictor Variables Food thrown away bothers Think about the cost of food thrown away Throw fruits and vegetables Throw saved leftover meal Food is natural and biodegradable Throw raw meat and fish Throw food left on the plate Throw processed meat Throw ready- to- cook meals Overall food wastage
Function 1
−.705
−.409
.382
.365
.353
.316
.313
.313
.307
.295
Note. ∗ Pooled within-groups correlations between discriminating variables and standardized canonical discriminant functions. Variables ordered by absolute size of correlation within function.
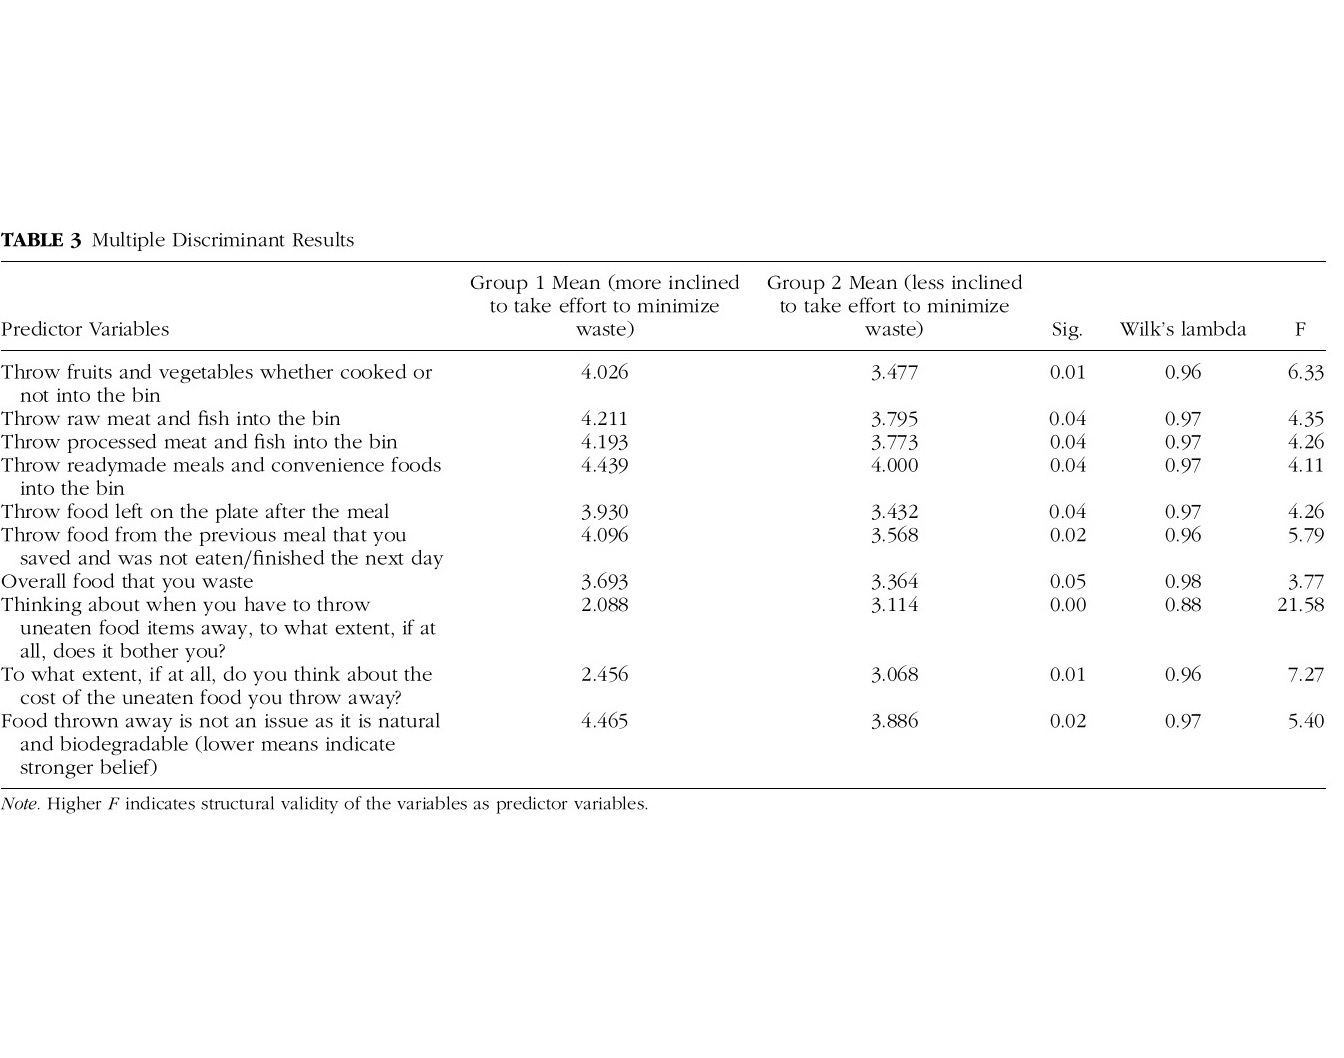
3.477
3.795
3.773
4.000
3.432
3.568
3.364
3.114
3.068
3.886
4.211
4.193
4.439
3.930
4.096
3.693
2.088
2.456
4.465
Group 2 Mean (less inclined to take effort to minimize waste)
4.026
Group 1 Mean (more inclined to take effort to minimize waste)
Note. Higher F indicates structural validity of the variables as predictor variables.
Throw fruits and vegetables whether cooked or not into the bin Throw raw meat and fish into the bin Throw processed meat and fish into the bin Throw readymade meals and convenience foods into the bin Throw food left on the plate after the meal Throw food from the previous meal that you saved and was not eaten/finished the next day Overall food that you waste Thinking about when you have to throw uneaten food items away, to what extent, if at all, does it bother you? To what extent, if at all, do you think about the cost of the uneaten food you throw away? Food thrown away is not an issue as it is natural and biodegradable (lower means indicate stronger belief)
Predictor Variables
TABLE 3 Multiple Discriminant Results
0.02
0.01
0.05 0.00
0.04 0.02
0.04 0.04 0.04
0.01
Sig.
0.97
0.96
0.98 0.88
0.97 0.96
0.97 0.97 0.97
0.96
Wilk’s lambda
5.40
7.27
3.77 21.58
4.26 5.79
4.35 4.26 4.11
6.33
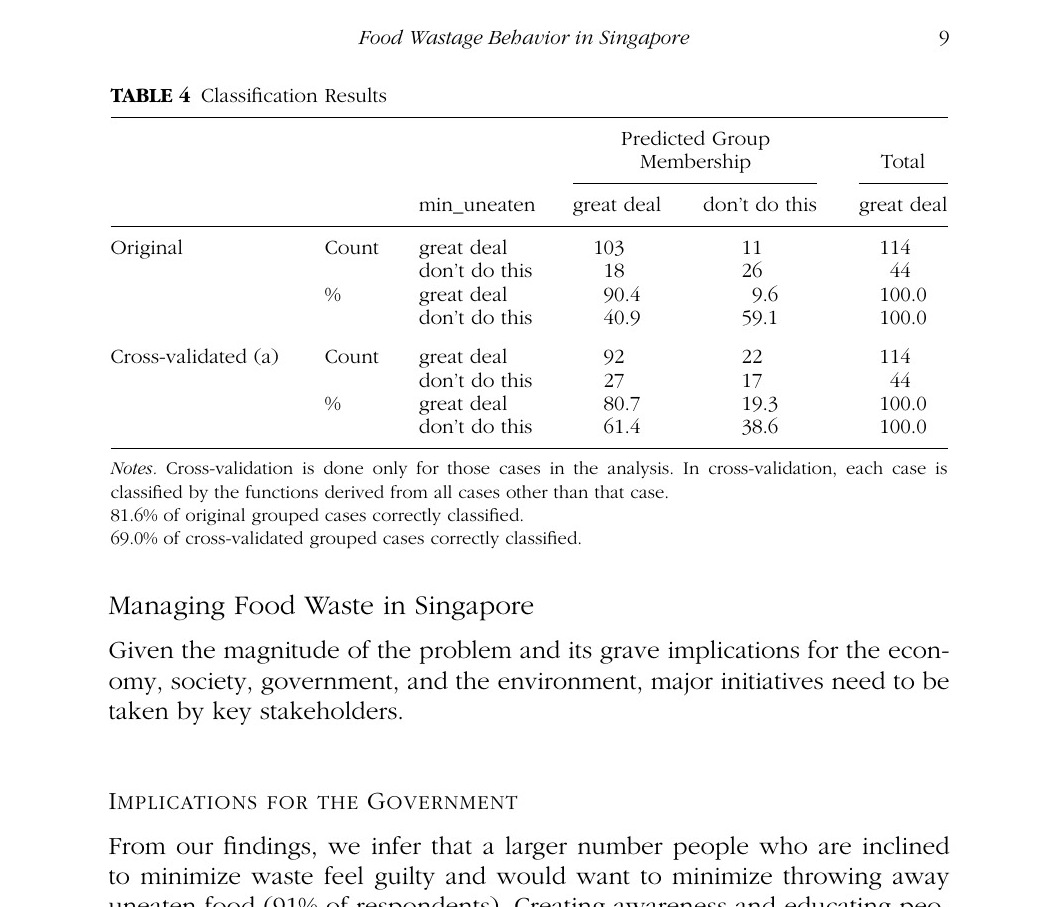
TABLE 4 Classification Results Predicted Group Membership
Original
Count %
Cross-validated (a)
Count
%
Total
min_uneaten
great deal
don’t do this
great deal
great deal don’t do this great deal don’t do this
90.4 40.9
9.6 59.1
100.0 100.0
great deal don’t do this great deal don’t do this
80.7 61.4
19.3 38.6
100.0 100.0
Notes. Cross-validation is done only for those cases in the analysis. In cross-validation, each case is classified by the functions derived from all cases other than that case. 81.6% of original grouped cases correctly classified. 69.0% of cross-validated grouped cases correctly classified.
Managing Food Waste in Singapore
Given the magnitude of the problem and its grave implications for the economy, society, government, and the environment, major initiatives need to be taken by key stakeholders.
Implications for the government
From our findings, we infer that a larger number people who are inclined to minimize waste feel guilty and would want to minimize throwing away uneaten food (91% of respondents). Creating awareness and educating people on consumption, storage particularly for fresh foods such as fruits and vegetables, raw meat, poultry, and fish would minimize the quantity of waste. “Food thrown away is not an issue as it is natural and biodegradable” shows non-conscious groups’ lack of awareness on the larger picture. Government bodies need to raise awareness levels. Children and young adults should be particularly targeted for communicating sustainable consumption habits. Restaurants can be advised to have statistical facts/data on food waste on the dining paper tablemats for people to read while waiting for orders. Creating segregation systems in the chutes of residential buildings could be helpful in managing the waste. Rewarding people who take initiative to invest in compost machines at an individual and community level could change people’s lifestyle. Food recycled into compost in Singapore can be used within Singapore for landscaping and organic farming, which can prove highly sustainable (Wilson, 2011). Carrie Wong, Waste Minimization and Recycling, manager for the National Environment Agency, believes that food waste management in Singapore is a work in progress. She conceded that there is no sorting of food (as packaged food waste, fresh food waste, packaging waste, nonedible waste such as peels and bones) in Singapore. There are also constraints on recycling food waste. Food waste is currently being incinerated in Waste to Energy (WTE) plants, and this contributes to 2% of total electricity generation in Singapore. There are tentative plans in the pipeline (e.g., budget allocation for subsidized land rates for food sorting initiatives) to encourage business establishments to undertake food sorting and recycling activities.
Implications for an NGO
Nongovernmental agencies should look at the initiative of reverse logistics with an entrepreneurial mindset, thereby converting this altruistic effort into a profitable business (Seelos & Mair, 2005; Brugmann & Prahalad, 2007). The founders of Food Bank, Singapore, Nicole Ng and Nicolas Ng, are in the business of distributing excess food from manufacturers, retailers, distributors, and consumers to community service providers that give away the food to the needy. According to them, the biggest challenge is changing the mindset of the people toward food waste. Singapore is a developed country with high disposable income. The value of food is not understood by many. Some of the reasons cited by retailers and other food service organizations for lack of donations were fear of food poisoning, legal implications of distributing spoiled food, tarnishing of provider’s brand image, lack of knowledge of customer preferences, more variants provided than needed, lack of resources to sort food as per expiry dates, and arranging for reverse logistics for collection and distribution of excess food.
Implications for a food marketer
Marketers can embrace social responsibility and engage in practices that minimize waste. They can focus on packaging food into small packs and loose items wherever possible, and they can provide storage tips on the packs for helping consumers manage their food stock better (Flack & Heblich, 2007). Instead of the “display until” date label, a “use by” or “best before” label is more useful in informing the consumer that the product cannot be safely used after the date on the label. Efficient packaging, including cooking directions, information on preserving food once opened, re-closable packs, airtight containers to store food, and bag clips to preserve freshness, will be helpful (Lyndhurst & WRAP, 2011). Social marketing gained prominence when the same principles used to sell products and services could be used to sell ideas, attitudes, and behaviors. Like commercial marketing, it is about providing what people need and not persuading them to buy what we produce (Weinrich, 2010).
Implications for a restaurant/food service provider
Likewise, food operators can take positive initiatives. Pay as you eat (in weight) is an alternative that restaurants could offer to encourage people to eat only what they need and in small portions. As part of their food waste management policy, restaurants can offer to serve food onto people’s plates after ordering and not keep the whole serving on the table for self-service. Live kitchens are also an ideal way of reducing food wastage. Mahesh Balakrishnan, founder and director of EatOnline Asia and Human Touch Mobile Development and Marketing is in regular touch with restaurants as part of his business operations for EatOnline Asia, which is a smartphone application for mobile food ordering. According to him, as food prices are high, and they cannot always pass on the cost to the consumers, restaurants can and should make efforts to reduce waste. These include innovative cooking methods such as using a base ingredient common to many dishes, thereby managing cost and effort. They pay for these bins based on the volume of the bin. They estimate the waste on a daily basis and thus request the bins. Regulations to improve food hygiene, such as requiring restaurants and hawker centers to change their cooked food every 3 to 4 hours, act as a deterrent to waste reduction in the short run; however, it will reduce waste in the long run when these food outlets make an effort to prepare bearing in mind consumer demand. There would be better demand forecast for the food on a daily basis.
Implications for Managing Food Waste in Singapore
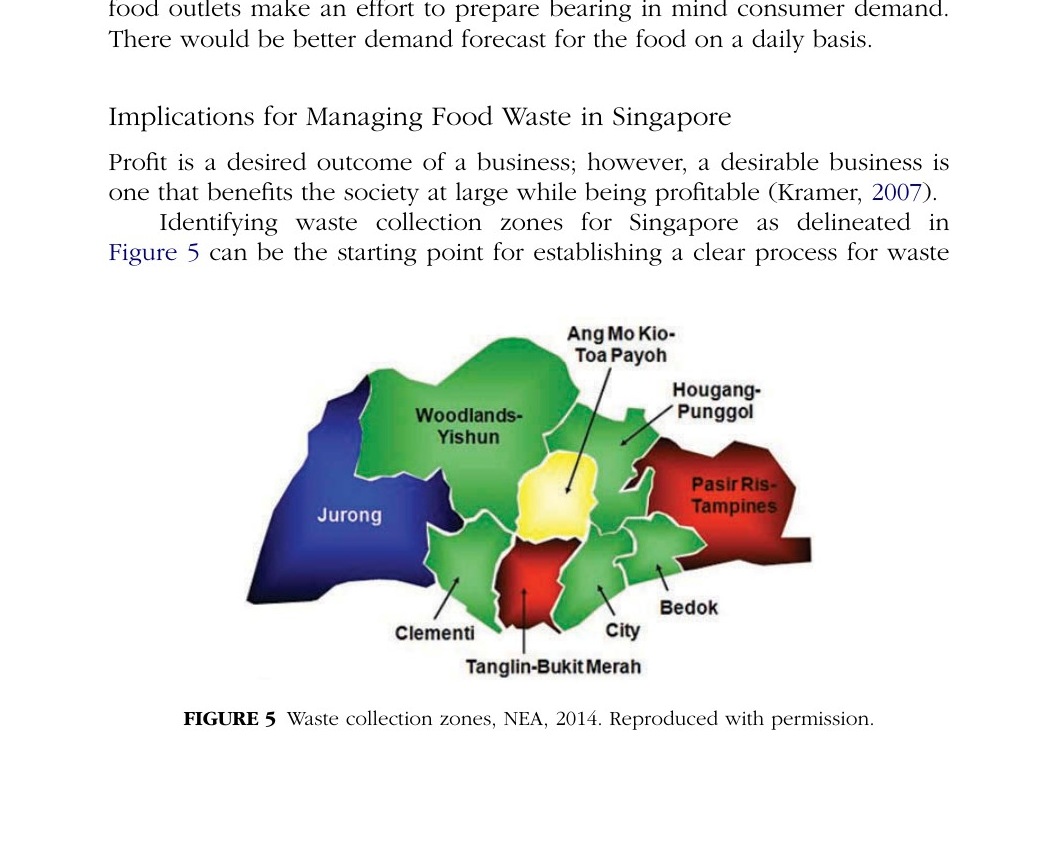
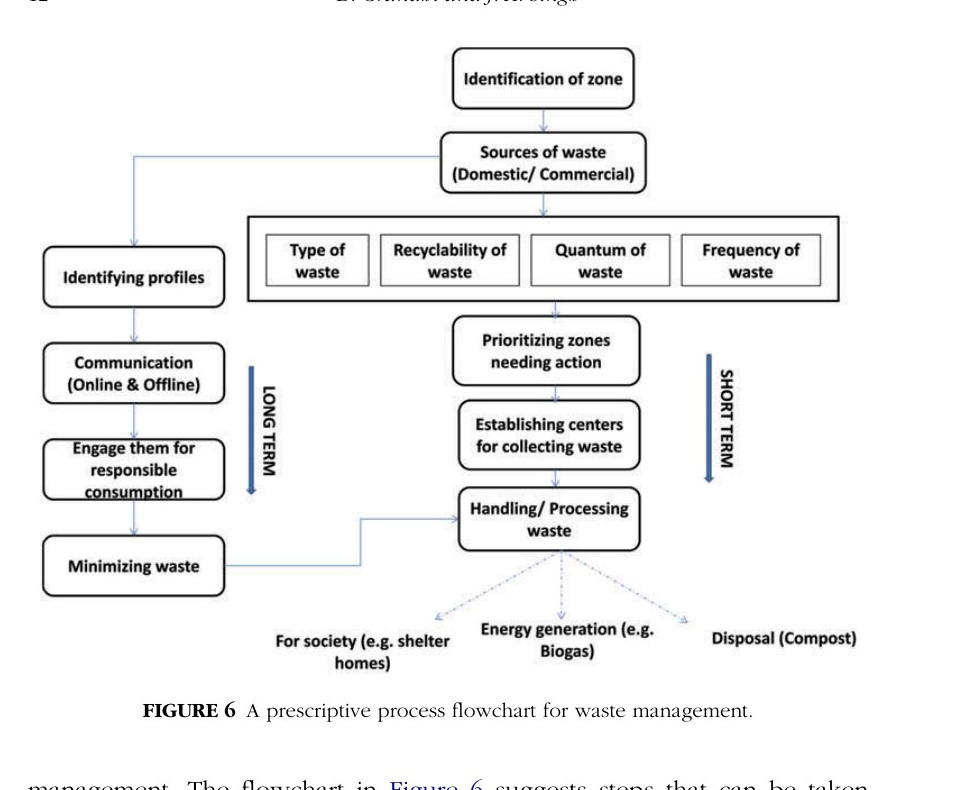
Profit is a desired outcome of a business; however, a desirable business is one that benefits the society at large while being profitable (Kramer, 2007). Identifying waste collection zones for Singapore as delineated in Figure 5 can be the starting point for establishing a clear process for waste management. The flowchart in Figure 6 suggests steps that can be taken both in the short and the long term by different stakeholders (Manaf, Samah, & Zukki, 2009; Zhang, Tan, & Gersberg, 2010; Pires, Martinho, & Chang, 2011). Upon identifying zones, one needs to identify the source of waste— whether domestic or institutional. Zones can be prioritized on the basis of type, recyclability, quantity, and frequency of waste.
Source. NEA, 2014. Reproduced with permission.
Several methods have been suggested for tracking food wastage:
- Diary method: Participants of the survey could keep track of the food wasted over a specified period in diaries—by collating which, estimates can be determined (Dowler, 1977; Gallo, 1980).
- Archaeological excavations method: Information is collected from the amount of garbage from each household, thereby providing estimates on the caloric value of the food wasted and the total waste levels. However, it excludes food being fed to animals, liquids thrown into drains, and waste thrown in compactors (Gallo, 1980; Muth et al., 2007).
- Plate waste examination: Food waste in institutions can be estimated by examining the waste from consumers’ plates; however, this is a resource- and time-intensive process (Dowler, 1977; Gallo, 1980; Muth et al., 2007).
- Inferential method: Estimates food waste based on the comparison of national-level data on overall food items purchased and consumed. It avoids consumer bias and provides comprehensive information of food wasted from different sources.
General perishable items such as fruits and vegetables are wasted the most, followed by bread, cereals, dairy items, fish, meat, and so forth (Stefan, 2011). According to a study in 2006, 70% of food waste consisted of fruits and vegetables (Pekcan, Köksal, Küçükerdönmez, & Ozel, 2006), and a WRAP 2008 study indicated that in the UK, this contributed to only 25% by weight (WRAP, 2009). These studies help us understand the categories of food that needs more attention in terms of reducing wastage. The next step would be establishing waste collection centers in zones needing attention. Segregating waste, handling each kind separately, making edible food available to needy communities, and disposing of nonedible food by converting to compost or generating energy (biomass) would be done at these centers. Long-term initiatives would entail profiling the food wasters in each zone on the basis of their demographic and psychographic characteristics, communicating and educating them using online and offline means, and promoting responsible consumption behaviors so they create lasting habits for minimizing waste. Waste that still occurs needs to be looped into the handling or processing stage of the method.
Research limitations
This research has certain limitations:
- Response bias may have occurred due to respondents not being aware that they waste food even when they end up wasting food. Due to the self-appraisal method of questions, there could be a tendency among the respondents to conceal the fact that they waste more food than declared.
- The sample size was small and not necessarily representative of the population composition in Singapore, thus adding bias.
- With a more scientifically drawn larger sample, we could have identified perhaps better the demographic and psychographic profiles of the different groups identified as per the multiple discriminant analysis.
Way forward
From our research, we infer that food waste in Singapore is an issue that needs to be addressed to bridge the gap between those who are in need of food and those who have it in excess (Khoo, Lim & Tan, 2009). The NEA Singapore is now placing greater emphasis on food waste management. The general public needs to be made aware of the issue of food waste (the amount of waste and the cost involved) through awareness campaigns and education. It should be made a part of life, and the next generation should embrace this habit. This study is particularly relevant to Singapore, which predominantly imports its food requirements. Studies conducted in the UK, the United States, and Australia reveal astonishing numbers in terms of the cost incurred due to food wastage. Food waste is biodegradable, and the emission of methane is the biggest concern as it is more dangerous than carbon dioxide and other greenhouse gases. Further, a huge amount of natural resources such as water and oil go into the production of food. With such alarming levels of wastage, we are fast running out of natural resources without even consuming or making good use of them. Last but not least, the availability of landfills for disposing of waste is another concern that needs to be addressed (Cuéllar & Webber, 2010). Wasteful behavior in developed countries not only affects them but also deprives developing countries of their fair share of food and resources (Food and Agriculture Organization, 2011). Currently, there are a billion people who are undernourished in the world, and, more interestingly, the amount of food wasted could have fed all of those who are in dire need of such a basic need (Stuart, 2009). Every effort should be made everywhere to minimize, if not eliminate, food wastage.
Acknowledgments
We would like to acknowledge the efforts of three students of S. P. Jain School of Global Management: Sreevatsan Sreenivasan, Viswanath Krishnan, and Urvashi Jain, whose commendable contributions have made this research possible.
References
- Arkes, H. R. (1996). The psychology of waste. Journal of Behavioral Decision Making, 9, 213–224.
- Brugmann, J., & Prahalad, C.K. (2007, February). Cocreating businesses’ new social compact. Harvard Business Review. Retrieved from https://hbr.org/2007/02/ cocreating-businesss-new-social-compact/ar/1
- Chappells, H., & Shove, E. (1999). The dustbin: A study of domestic waste, household. International Planning Studies, 4(2), 267–270.
- Cuéllar, A. D., & Webber, M. E. (2010). Wasted food, wasted energy: The embedded energy in food waste in the United States. Environ. Sci. Technol, 6464–6469.
- De Coverly, E., McDonagh, P., O’Malley, L., & Patterson, M. (2008). Hidden mountain. The social avoidance of waste. Journal of Macromarketing, 28, 289–303.
- Dowler, E. (1977). A pilot survey of domestic food wastage. Journal of Human Nutrition, 31, 171–180.
- Exodus Market Research. (2007). We don’t waste food! A householder survey. Retain Programme—Food Waste; Final Report. Oxford, UK: Waste & Resources Action Programme (WRAP). Retrieved from http://www.wrap.org.uk/sites/files/wrap/ We_don_t_waste_food_-_A_household_survey_mar_07.db6802f9.6397.pdf
- Flack, O., & Heblich, S. (2007). Corporate social responsibility: Doing well by doing good. Business Horizons, 50, 247–254.
- Food and Agriculture Organization. (2011). Global food losses and food waste— Extent, causes and prevention. Rome, Italy: Food and Agriculture Organization.
- Gallo, A. E. (1980). Consumer food waste in the United States. National Food Review (pp. 13–16). Washington, DC: Economic Research Service, U. S. Department of Agriculture.
- Gustavsson, J., Cederberg, C., Sonesson, U., Otterdijk, R. v., & Meybeck, A. (2011). Global food losses and food waste. International Congress. Düsseldorf: Save Food. Retrieved from http://www.fao.org/docrep/014/mb060e/mb060e00.pdf
- Hall, K., Guo, J., Dore, M., & Chow, C. (2009). The progressive increase of food waste in america and its environmental impact. Plos One, 4(11): e7940. doi:10.1371/journal.pone.0007940
- Hamilton, C., Denniss, R., & Baker, D. (2005). Wasteful consumption in Australia (Discussion Paper 77). Manuka, Australia: The Australian Institute.
- Khoo, H. H., Lim, T. Z. & Tan, R. B. (2009). Food waste conversion options in Singapore: Environmental impacts based on an LCA perspective. Science of the Total Environment.
- Kramer, M. R. (2007). Strategy and society: The link between competitive advantage and corporate social responsibility. Retrieved from http://www.hks.harvard. edu/m-rcbg/CSRI/events/2006.10.10_Mark%20Kramer_Presentation.pdf
- Lyndhurst, B. (2007). Food behavior consumer research: Quantitative phase. Retail Programme—Food Waste: Final Report. Oxford, UK: Waste & Resources Action Programme (WRAP). Retrieved from http://www.wrap.org.uk/sites/files/wrap/ Food%20behaviour%20consumer%20research%20quantitative%20jun%202007. pdf
- Lyndhurst, B., & WRAP. (2011). Helping consumers reduce food waste—A retail survey 2011. Oxon: Waste & Resources Action Programme. Retrieved from http://www.wrap.org.uk/sites/files/wrap/240412%20Retailer%20review% 202011%20ES.pdf
- Manaf, L., Samah, M. A., & Zukki, N. (2009). Municipal solid waste management in Malaysia: Practices and challenges, Waste Management, 29, 2902–2906.
- National Environment Agency (NEA). (2014). Key environmental statistics 2014. Retrieved from http://app.mewr.gov.sg/data/ImgCont/52/MEWR% 20KES%202014.pdf
- National Environment Agency (NEA). (2014). Overview. Retrieved from http://www. nea.gov.sg/energy-waste/waste-management/overview
- National Environment Agency (NEA). (2014). Waste statistics and overall recycling. Retrieved from http://www.nea.gov.sg/energy-waste/wastemanagement/waste-statistics-and-overall-recycling
- Pekcan, G., Köksal, E., Küçükerdönmez, O., & Ozel, H. (2006). Household food wastage in. Rome: FAO.
- Pires, A., Martinho, G., & Chang, N. (2011). Solid waste management in European countries: A review of systems analysis techniques, Journal of Environment Management, 92, 1033–1050.
- Seelos, C., & Mair, J. (2005). Sustainable development: How social entrepreneurs make it happen. (IESE Business School Working Paper No. 611). Retrieved from http://dx.doi.org/10.2139/ssrn.876404
- Singapore’s Second National Communication. (2010). Singapore’s Second National Communication. Singapore: National Environment Agency. Retrieved from http://app.nccs.gov.sg/data/resources/docs/singapore’s%20second%20national %20communications%20nov%202010.pdf
- Stuart, T. (2009). Waste: uncovering the global food scandal. London, UK: W.W. Norton.
- Tay, E. (2013, April 1). Singapore waste statistics 2012. Retrieved from http://www. zerowastesg.com/2013/04/01/singapore-waste-statistics-2012/
- Von Braun, J. (2007). The world food situation. Washington, DC: Food Policy Report.
- Weinrich, K. N. (2010). Weinreich communications. Retrieved from http://www. social-marketing.com: http://www.social-marketing.com/Whatis.html
- Wilson, D. (2011). Acting alone to partnerships—Strategic approach for sustainable waste management. In UN Commission for Sustainable Development (CSD) Intersessional Conference on Building Partnerships for Moving towards Zero Waste (pp. 16–18). Tokyo, Japan: United Nations Center for Regional Development.
- WRAP. (2008). The food we waste. Banbury: ISBN.
- WRAP. (2009). Household food and drink waste in the UK. Banbury: ISBN.
- Zhang, D. Q., Tan, S. K., & Gersberg, R. M. (2010). Municipal solid waste management in China: Status, problems and challenges. Journal of Environmental Management, 91, 1623–1633.